Data visualization
Summary
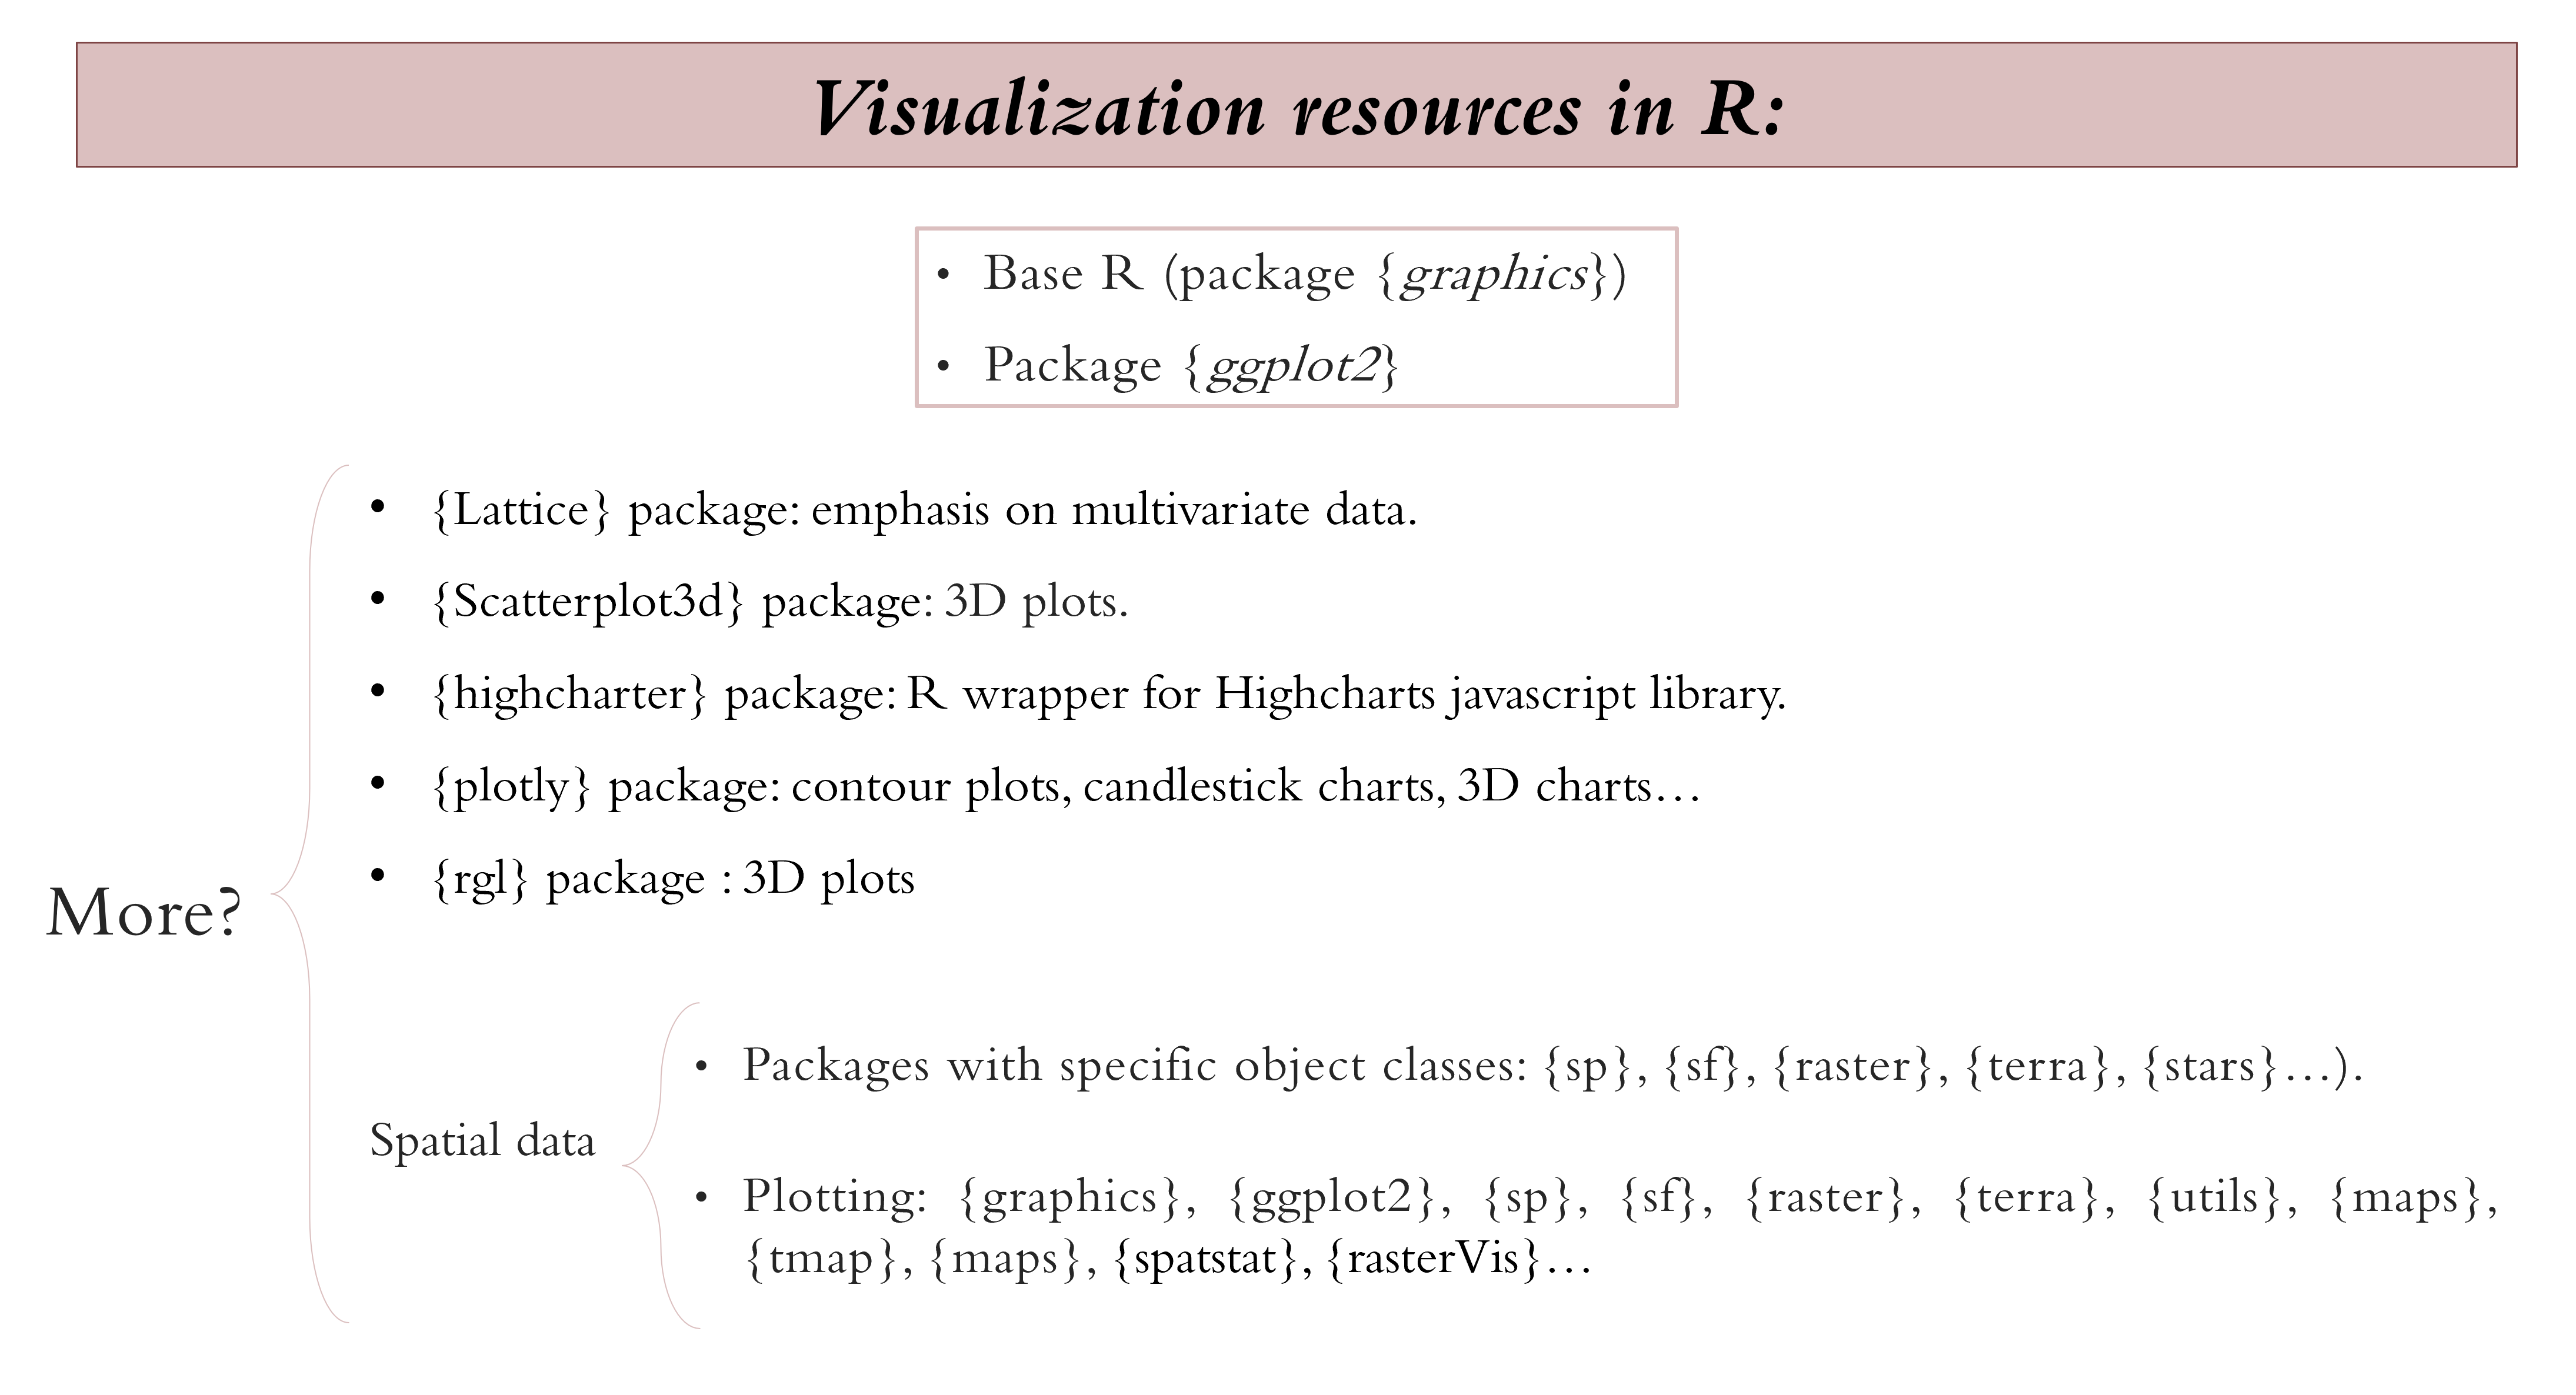
This unit of the workshop covers the basics of data visualization. The theory includes basic design principles, such as colour and type, how to choose graphs according to your data, file types to export your graphs in, and common mistakes to avoid in data visualization. The practical focuses on visualizing data using ggplot2, as well as plotting vector and raster spatial data. The slides for the unit are available here and provide an introduction to some of the most commonly used resources. The code for the ggplot2 tutorial is available here, as well as for the spatial data tutorial here.
This session is led by Sofía Galván and Miranta Kouvari. If you encounter any issues while working with the tutorials, please contact Sofía here. If you have any questions or further enquiries on the theory covered, please contact Miranta here.
Resources
![]()